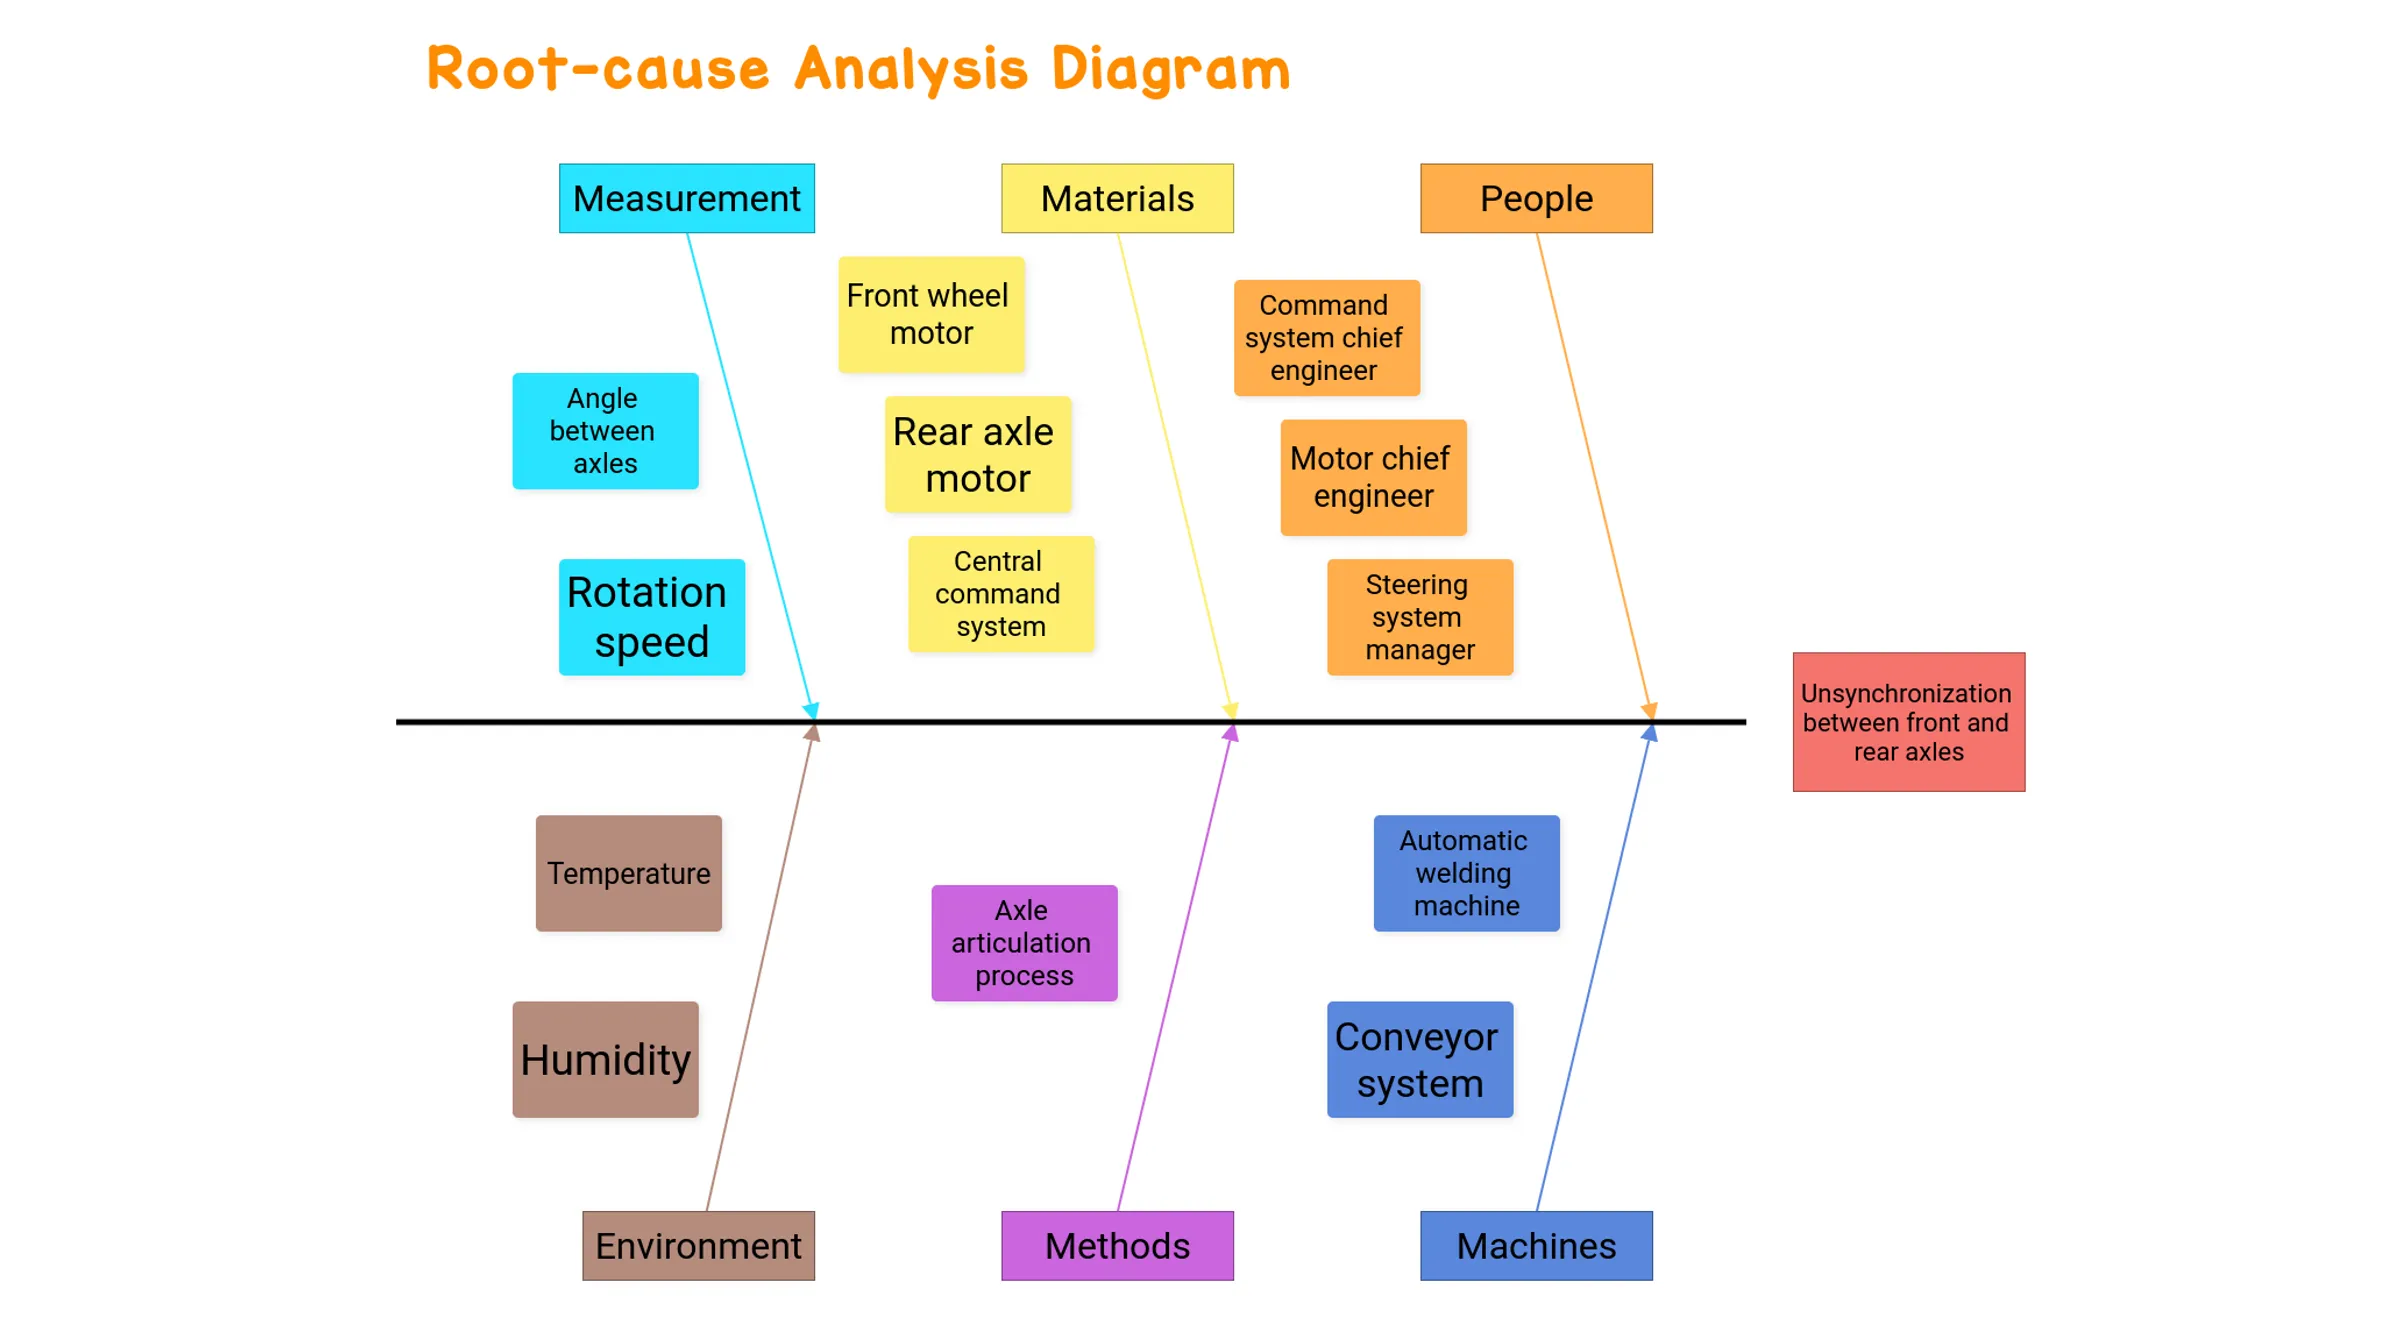
Root-cause Analysis Diagram

What is the Root-Cause Analysis Diagram?
The Root-Cause Analysis Diagram, also known as the Ishikawa Diagram, is an important tool in Lean Management. Its purpose is to help teams identify potential sources of a particular problem or effect in a structured and visual way. The diagram was created by Kaoru Ishikawa, a Japanese quality management expert, in 1968 while working for the conglomerate Kawasaki.
How to Build a Root-Cause Analysis Diagram?
To build a Root-Cause Analysis Diagram, you should follow these four steps:
-
Step 1: Define the problem
Start by clearly and precisely identifying the problem to be analyzed. The problem must be specific, measurable, and time-defined. Write the problem in a rectangle on the right side of the diagram.
-
Step 2: Establish cause categories
Define the main factors that could be causing the problem. These factors are generally grouped into categories for ease of analysis. In an industrial context, the categories used are generally as follows: Materials, Manpower (People), Methods (Processes), Machines (Equipment), Medium (Environment), and Measurements.
-
Step 3: Identify Sub-Causes
List the possible causes of the problem. The exercise must be carried out with a view to completeness, taking the time to think about all the possibilities without judging them at this stage.
-
Step 4: Analyze and prioritize the causes
Analyze each cause as a team and determine which ones are most likely to be causing the problem.