by JimAgine | Feb 2, 2024 | Popular Templates, Template, Visual Management
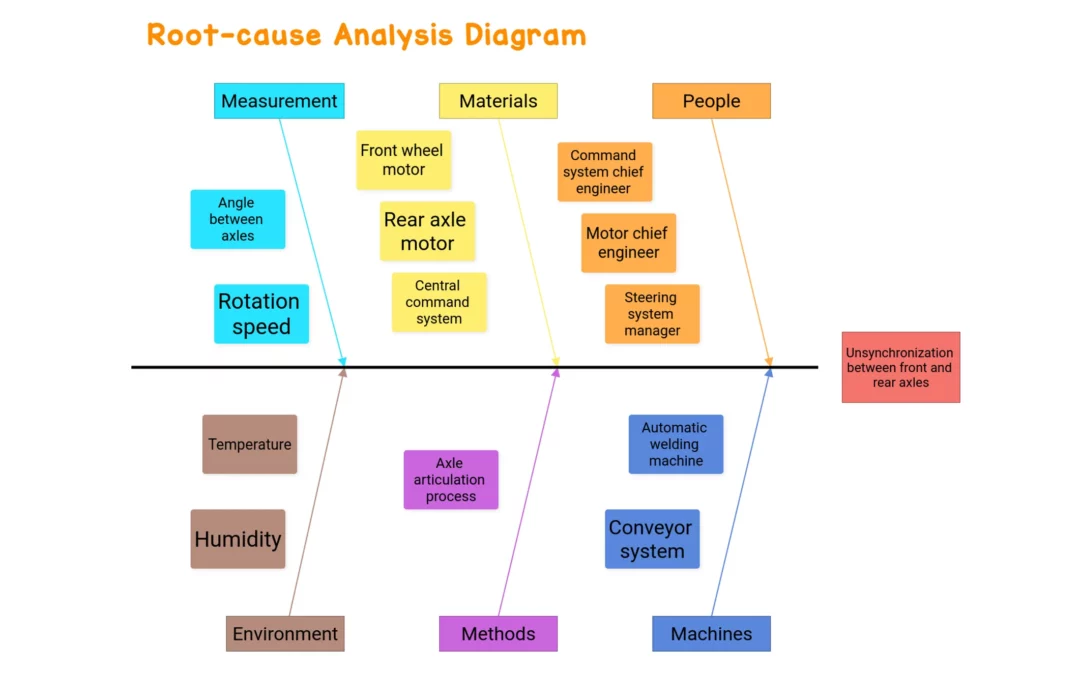
Examples Root-cause Analysis Diagram Root-cause Analysis Diagram Try example*No account required What is the Root-Cause Analysis Diagram? The Root-Cause Analysis Diagram, also known as the Ishikawa Diagram, is an important tool in Lean Management. Its purpose is to...
by JimAgine | Feb 2, 2024 | Template, Visual Management
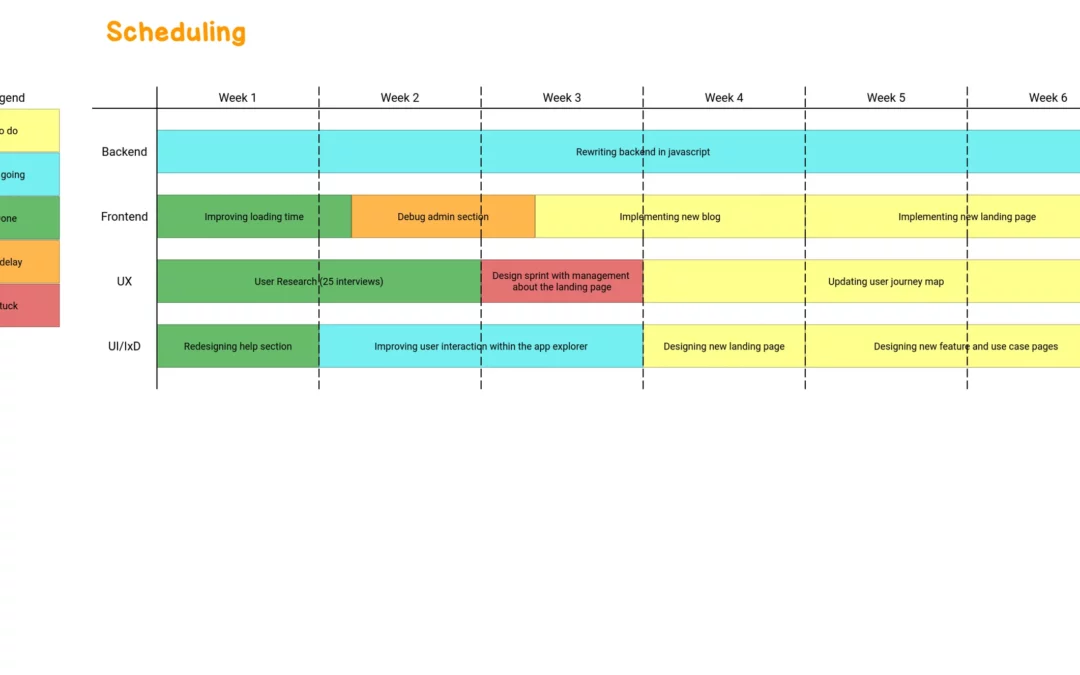
Examples Scheduling Scheduling Plan Try example*No account required What is a Scheduling Plan? A Scheduling Plan is a tool used to schedule and optimize the use of processes and resources in accordance with production demands. It allows for an accurate representation...
by JimAgine | Feb 2, 2024 | Template, Visual Management
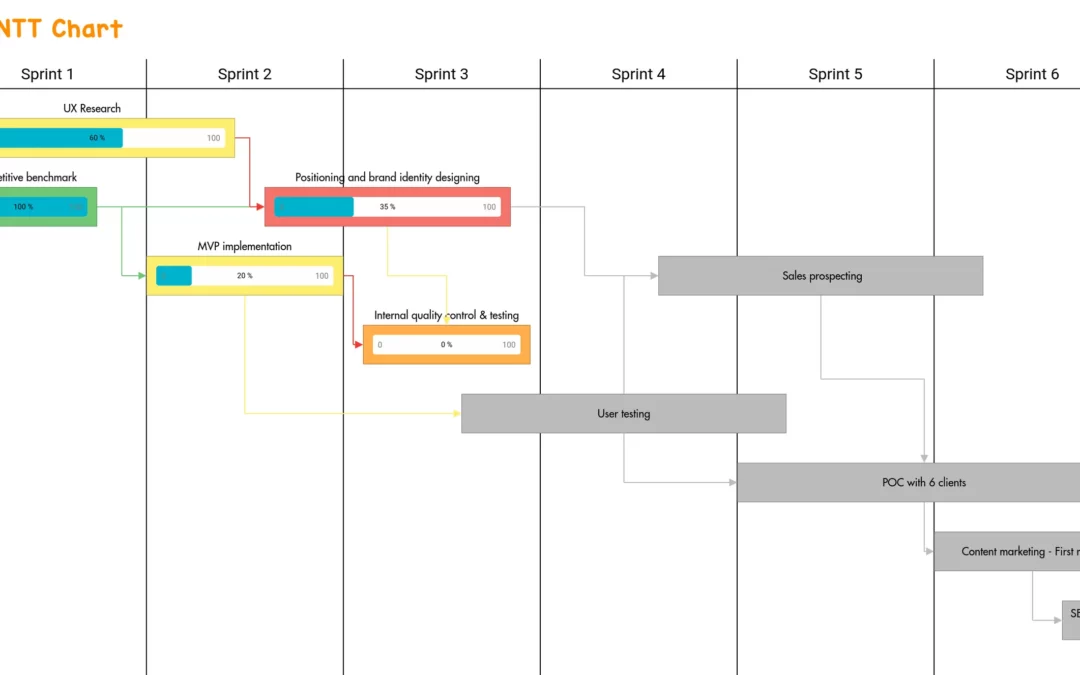
Examples Gantt Chart Gantt Chart Try example*No account required What is a Gantt Chart? A Gantt Chart is a planning tool that visualizes the logical sequence of a project’s tasks, from start to finish, over a set period of time. Additionally, it highlights...
by JimAgine | Feb 2, 2024 | Popular Templates, Template, Visual Management
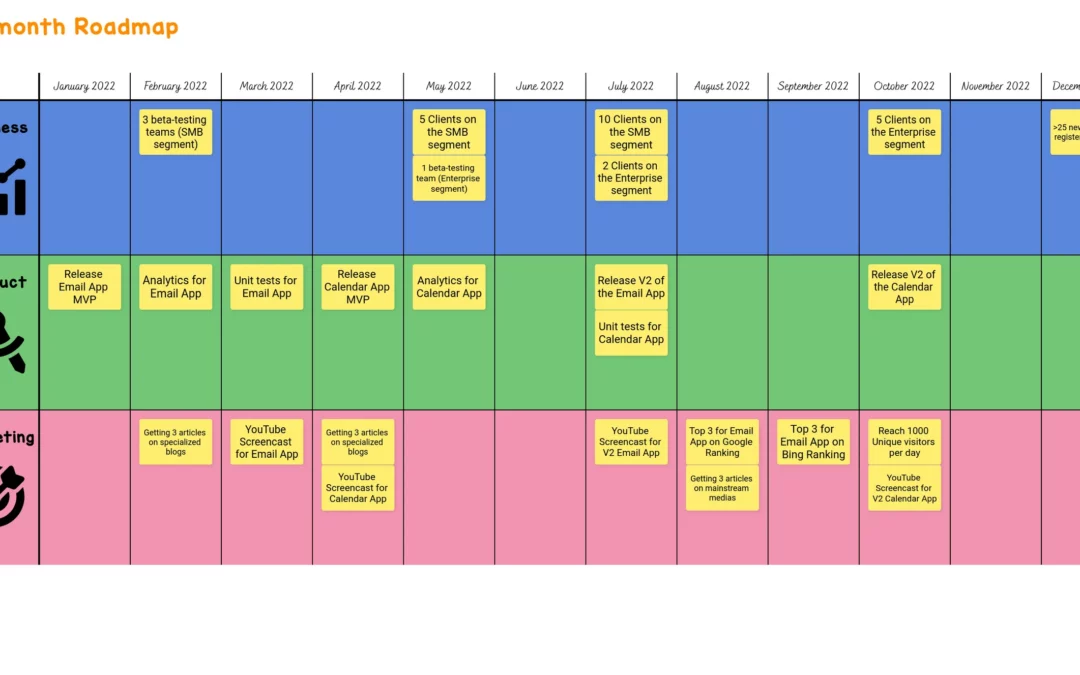
Examples 12-month Roadmap 12-month Roadmap Try example*No account required Construction step by step of the "12-month Roadmap"...
by JimAgine | Feb 2, 2024 | Template, Visual Management
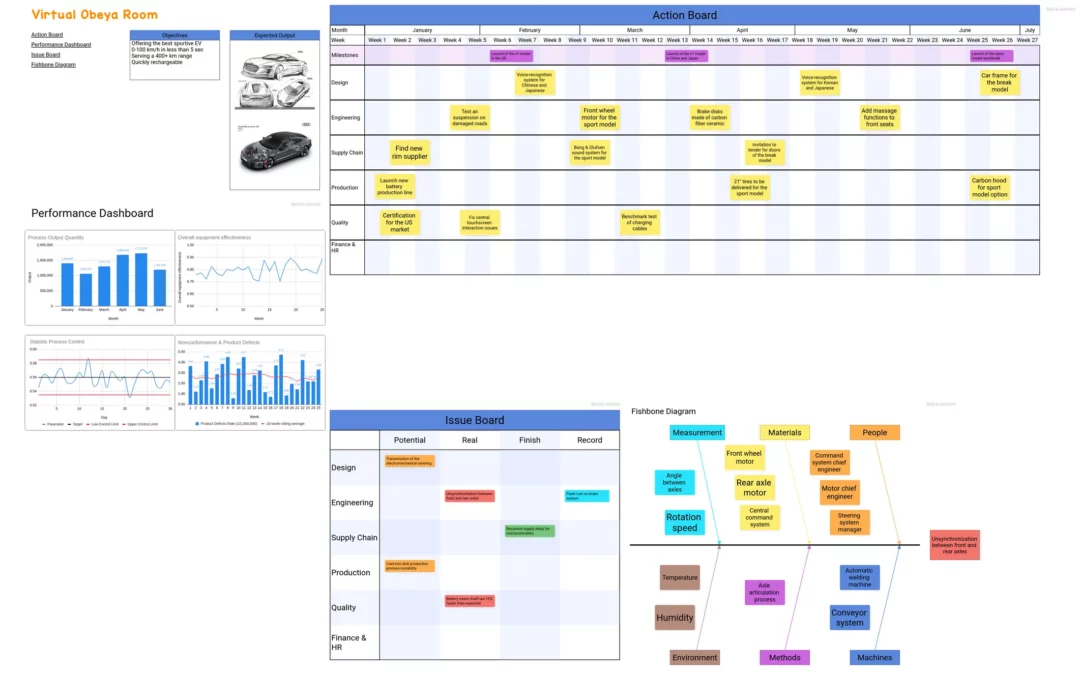
Examples Virtual Obeya Room Virtual Obeya Room Try example*No account required What is Obeya? The word Obeya means “big room” in Japanese. It describes a central place where leaders and operational teams within organizations can leverage visual management tactics...


